
IntelliJ IDEA 卡成球了?

目標
測試機器和項目
測試場景
在 Idea 中關閉所有項目 基于測試文件 idea.vmoptions 進行設置 重啟電腦 啟動后關閉所有不相關的項目( communicators 等等) 打開 Idea(測試時間) 打開大項目(測試時間) 檢查 jstat -gcutil 打開兩個微服務項目(測試時間) 檢查 jstat -gcutil 返回大項目然后點擊“刷新 Gradle 項目”按鈕(測試時間) 檢查 jstat -gcutil
jstat -gcutil
-gcutil - Summary of?garbage collection statistics.
S0: Survivor space 0?utilization as?a percentage of?the space's current capacity.
S1: Survivor space 1 utilization as a percentage of the space's current capacity.
E: Eden space utilization as?a percentage of?the space's current capacity.
O: Old space utilization as a percentage of the space's current capacity.
M: Metaspace utilization as?a percentage of?the space's current capacity.
CCS: Compressed class space utilization as a percentage.
YGC: Number of young generation GC events.
YGCT: Young generation garbage collection time.
FGC: Number of full GC events.
FGCT: Full garbage collection time.
GCT: Total garbage collection time.
S0?????S1????E?????O?????M????CCS??YGC?YGCT?FGC??FGCT???GCT
89.70?0.00?81.26?74.27?95.68?91.76?40 2.444?14 0.715??3.159
默認(灰色標識)
-Xms128m
-Xmx750m
-XX:MaxPermSize=350m
-XX:ReservedCodeCacheSize=240m
-XX:+UseCompressedOops
Big(大)(紅色標識)
-Xms1024m-Xmx4096m-XX:ReservedCodeCacheSize=1024m-XX:+UseCompressedOops
Balanced(平衡的)(藍色標識)
-Xms2g
-Xmx2g
-XX:ReservedCodeCacheSize=1024m
-XX:+UseCompressedOops
Sophisticated(復雜的)(橘色標識)
-server
-Xms2g
-Xmx2g
-XX:NewRatio=3
-Xss16m
-XX:+UseConcMarkSweepGC
-XX:+CMSParallelRemarkEnabled
-XX:ConcGCThreads=4
-XX:ReservedCodeCacheSize=240m
-XX:+AlwaysPreTouch
-XX:+TieredCompilation
-XX:+UseCompressedOops
-XX:SoftRefLRUPolicyMSPerMB=50
-Dsun.io.useCanonCaches=false
-Djava.net.preferIPv4Stack=true
-Djsse.enableSNIExtension=false
-ea
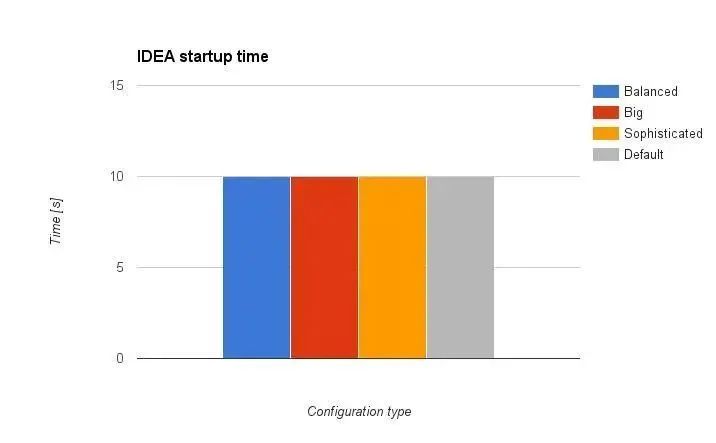
Idea啟動時間
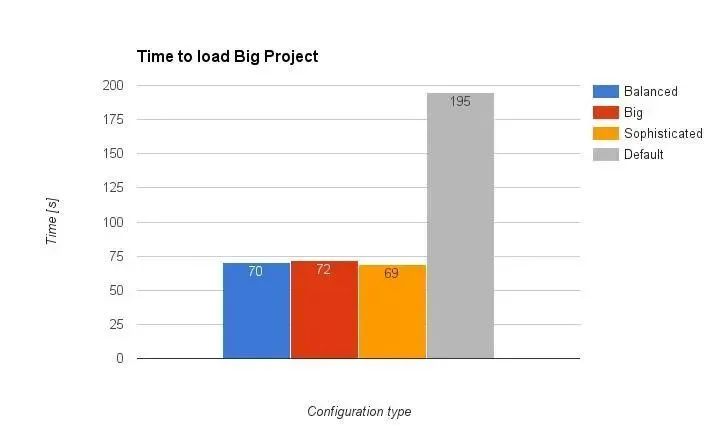
加載大項目花費的時間
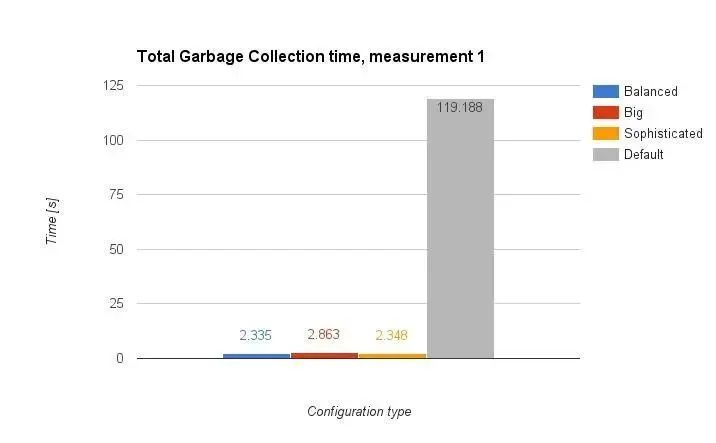
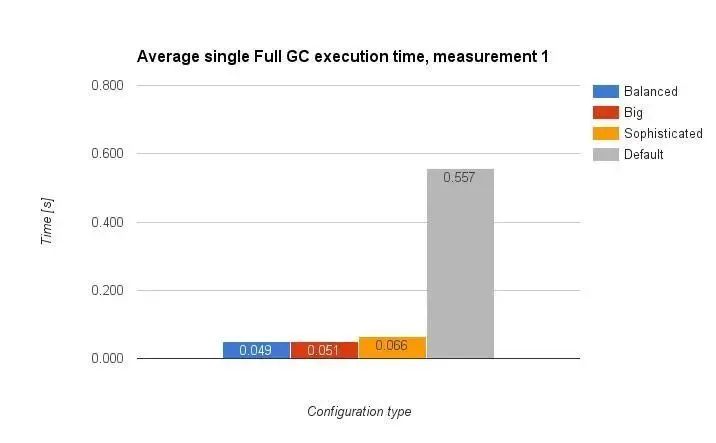
jstat -gcutil
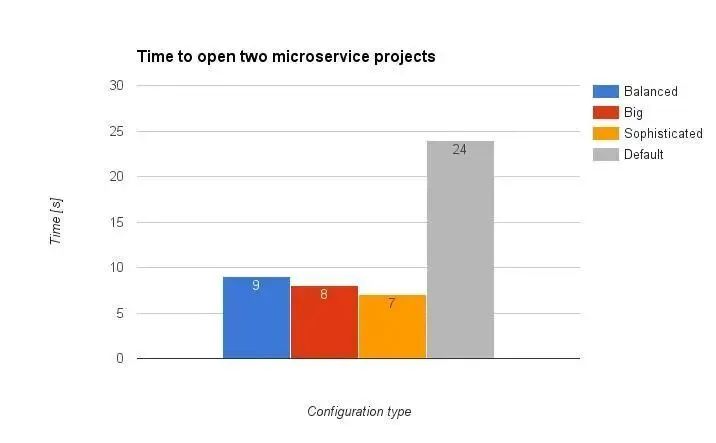
在IDEA中打開兩個微服務
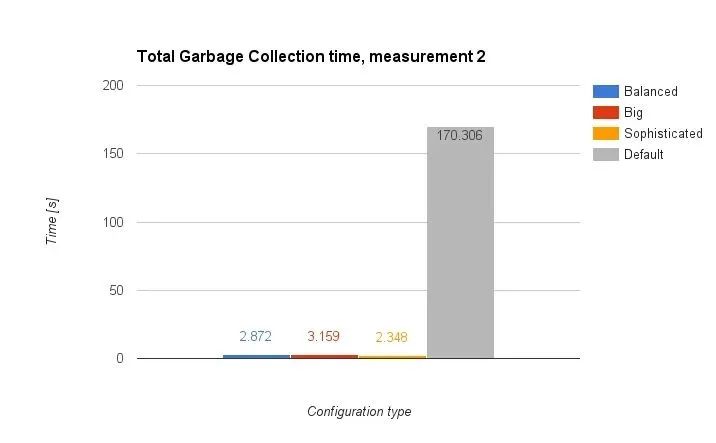
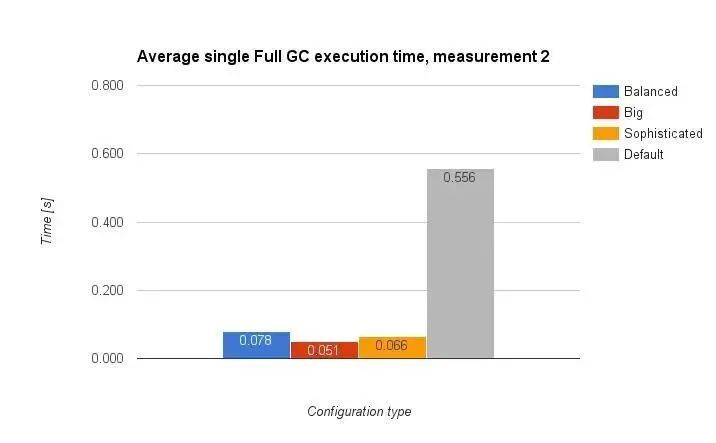
再次使用jstat –gcutil
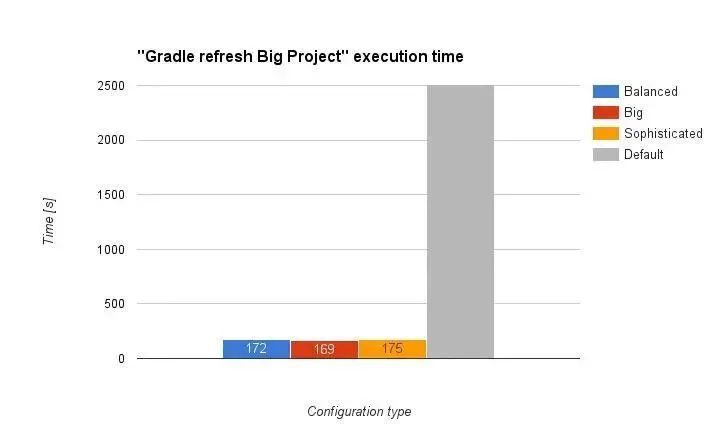
最后的角逐:重新加載Monolith
最后一次使用jstat-gcutil
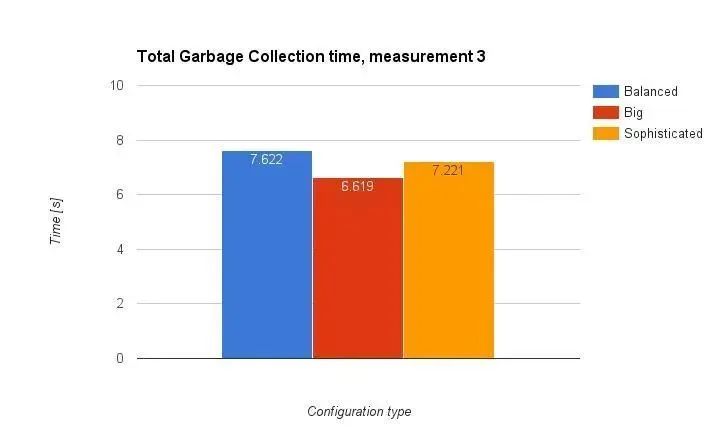
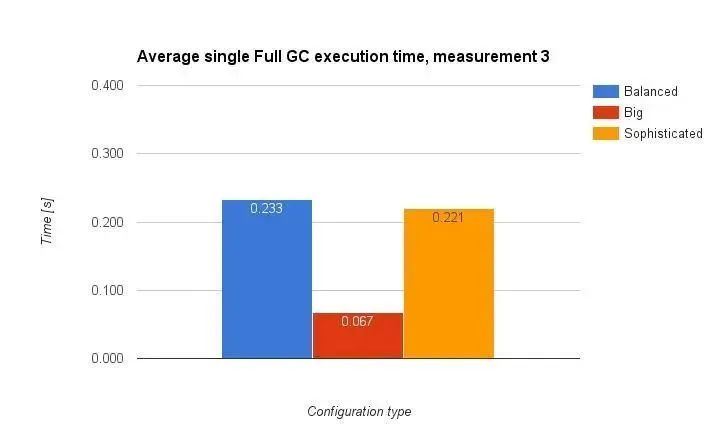
總結
推薦閱讀:
 喜歡我可以給我設為星標哦


評論
圖片
表情